RANSAC
撰写于 2020-11-06 修改于 2021-07-07 views
RANSAC
What is RANSAC stands for random sample consensus?
It’s a quite simple but highly effective algorithm that you can use if your data is affected by outliers. So whenever you work with real-world sensors, your sensor data will never be perfect and quite often your sensor data is affected by outliers. So by data points that are not explained well by the real world. And RANSAC is kind of a trial and error approach that will group your points into an inlier set and into an outlier set. So you can forget about the outliers and work with your inliers.
How RANSAC works? We want to fit a line through 2D data points. How can we do that? So consider these our data points, some of those data points will lie on the line at least approximately but others are outliers. How can we separate them into inliers and outliers? We just randomly draw two of our data points and fit a line through those two points. Why two? Because two is the minimum number of points that I need to fit a line. So let’s say I select those two points and fit a line through those two points. Then I simply check how many of the remaining data points so all the data points except the two that has fair sample will agree with this line. Say this model gets a score of four. Let’s repeat the process and see how we will do next time. So I again sample two data points in this case those two. I will fit my model for them so solve that task that I want to solve. An d then score how many data points agree with this model, in this case this would be 12.
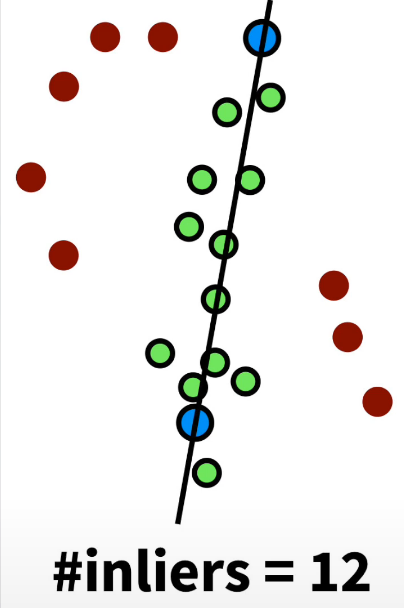
Then repeat this over and over again ten times, hundred times, thousand times and then select the model which has the high score so which has the best support of the remaining data points and that’s my solution which is then the inlier points, there so the supporting points plus the two points that our sampled is my inlier set worth of the outlier set. So I just continue working with mu green points. That’s basically that’s what RANSAC is about.
So it’s simple 3 step procedure. The first step is sampling, we sample a subset of data points and we consider those points to be inliers for this iteration so we treat them as liners . All computation that we do are based on these two points and we treat them as inliers. S the step number two is a task specific step, we will take those potential inliers and we will compute the model parameters or solve the tasks that we actually want to solve and then the third step is scoring step. Where we see how many of the remaining data points will support this model and by simply counting them I can compute the score. Then I repeat this process over and over again and the ends take the model is best supported by the data which then tells me which are the inlier points which are the outlier points.
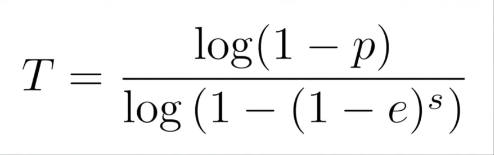
How often do I need to try? That’s actually something that we can compute so if you want to success with probability P let’s say 99.9 percent. Then this formula tells us that if you want to success with probability P and the outlier ratio in our data points is e. So let’s say 20% or 40% or 60%. And we need to sample s points to compute my model so in our example this would have been two. Then this formula tells you how many trails T you need in order to succeed with probability P.
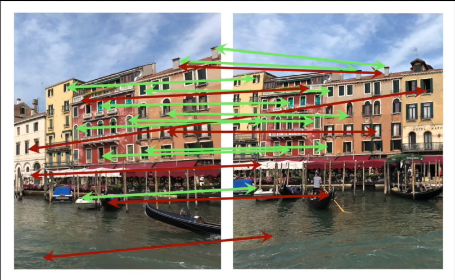
So RANSAC is a frequently used algorithm whenever you work with the real-world sensor data. For example to compute visual odometry that means estimating the motion of a camera through the environment by taking into account the corresponding points in pairs of consecutive images so then can compute the relative orientation of the camera just based on those correspondences. And given that this approach is kind of sensitive with outliers so you need to make sure we have only inliers in order to estimate the trajectory well. And RANSAC is the approach that helps me to get rid of those outliers here.