
Factor Graph
撰写于 2020-11-14 修改于 2021-07-07 views
Factor Graph
So what is a factor graph?
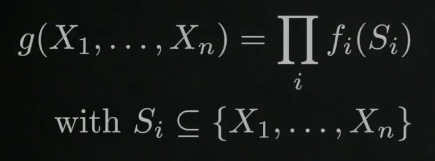
A factor graph is in mathematical terms a bipartite graph representation the factorization of a function. So what does that mean? That means we can take a function g for example. Break the function g down in a product of functions f and the functions f depend on the subset of the variables that the function g depends on. So that means we can take this function g which let’s say depends on 10 variables and break it down into a product of functions and all those individual functions depend on a smaller number, a smaller subset so less than 10 variables. And this is a very handy tool in the context of probability distributions because the factor graph allows me to represent a joint probability distributions that means the distribution ranging over all variables into a product of smaller probability distributions. Smaller means that it depends on a smaller number of variables and similar to other graphical models such as bayes networks or markov networks, we can use factor graphs to describe independence relations in between variables and we can run different algorithms on these factor graph which allows us to do certain inference tasks in an efficient way.
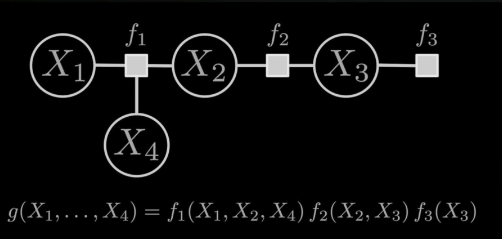
So let’s look into a small example of a factor graph. So a factor graph has nodes which stores those variables indicated with those circles and then it has factors which are those small rectangles which represent the individual functions. So if a factor connects two、three、four or more nodes, it means this is one of those small functions f and the nodes which ridges connects to are the function depends on. And then the overall function of all variables can be represented as a product of these individual functions.
This is very common tool used in for example state estimation problem, slam bundle adjustment and other techniques in order to describe how certain variables depend on each other. There is strong relation between bayes networks, markov networks and those factor graph we can actually show the bayes networks, markov networks can be represented as a factor graph as well. And they are popular algorithms defined on factor graph for example the sum-product algorithm that used to compute marginal distributions, so distribution that only depends on a subset of those variables and it is in the context of robotics and computer vision often used to describe least squares problems. So the least square problems happen or occur very often again mapping task, three reconstruction tasks, just these small examples. And in this context, factor graphs are often used to represent how different state variables those nodes depend on or related with for example the observations for which those factors are used to describe how nodes are related with each other based on the information that we have gathered from our sensor data and which is stored in those factors. It’s a very common tool when performing for example least squares or the state estimation tasks. There are also popular systems out there that have been proposed for example for slam bundle adjustment. This is the SAM, GTSAM SYSTEM, iSAM different variants which are used for wide range of applications, and factor graphs become especially handy as a tool for visualizing the dependency of those problems and specially if you have multiple sensors involved. So for multi-sensor system they’re very attractive, because you basically generate factors for a camera you use for laser scanners for describing a scan matching process. Or a visually inertial navigation factor can describe how this information, how this central information relates the variables we want to estimate the nodes with each other and it can do that in a very intuitive way and things tools that we have used such as a post graph in slam can of course also be represented as factor graphs. factor graphs are some more general description and therefore became very popular over the last years.