
Image Multilabel Recognition
撰写于 2020-11-30 修改于 2021-07-07 views
[TOC]
Image Multilabel Recognition
一、Overview
Definition
What?
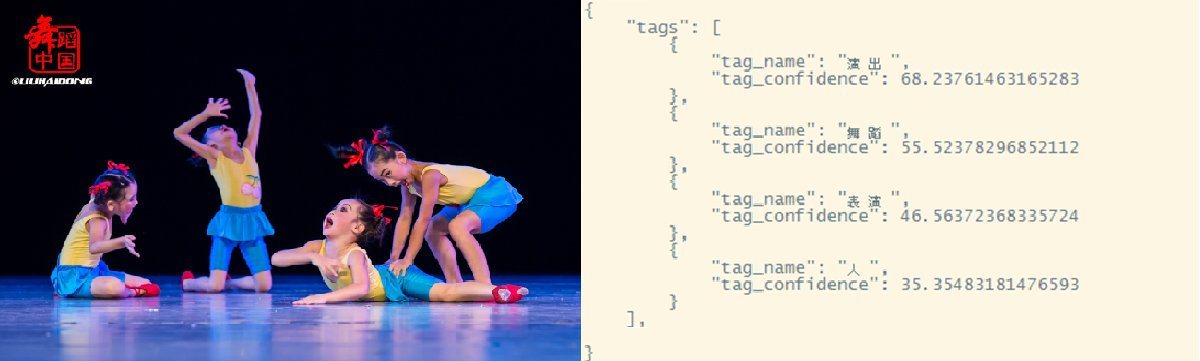
People seem like take photos for wonderful views as a precious collections in daily life. Therefore, it’s absolutely necessary for them to arrange the photos efficiently. The key problem is how to identity the scenes in album photos using artificial intelligence technology.
Label systems?Properties?
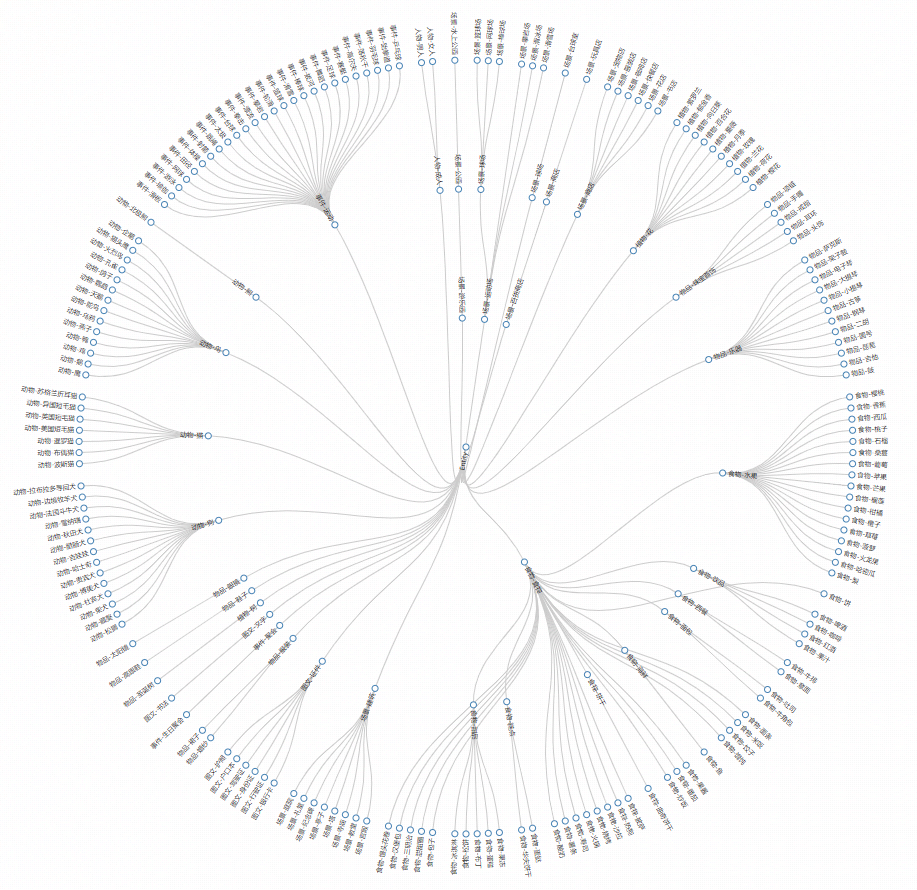
Label systems
There are mainly eight parent categories in the label system according to the frequency of the scenes appears in the album photos. For example:
Human: adult, group photo, etc;
Animal: cat, dog, etc; long tail labels contained, such as poodle, Scottish fold;
Scene: supermarket, office, architecture, etc;
……
Properties
The label system has properties of 4N as follows, which are the most hardest for this algorithm.
Non-systematic: not in the hierarchical relationship form of both parents and children categories;Non-atomic:A single category covers a wide range of forms and types. For example, class “sing” covers a great variety of types, it can be one person singing while standing there, it can be many people stand up and singing, it also can be many people singing while doing some movements;Non-independence:correlation, the rlationship between the two categories is neither mutually exclusive nor identical. For example, class “painting” and class “cartoon”, if the image is one character painted from one cartoon, the annotation of the image contains both of them;Non-unity:causality, there is a situation occurs one class where another class exist. For example, there must have class “tree” when the image mainly in “forest”.
Next, we will give a detailed explain of three modules: dataset, algorithm and Inference.
二、Construction of Dataset
management of data
Initialization
In order to ensure the integrity and diversity of the dataset, the construction to initial the dataset is mainly contains the following three aspects.
Open source dataset
open-images v5 [1]
Open images dataset is proposed by Google,there are details of basic information of this dataset in paper OID-dataset. In addition, the OID-paper also give a detail introduction of construction of dataset, annotation process of dataset, train procedure of dataset and evaluation of model trained using the dataset. Since all the data is from Flickr, it is more realistic and in line with the real scene. It contains a total of 8000 classes on 1.9M images, The images are very diverse and often contain complex scenes with several objects (8.3 per image on average). It’s suit for dataset initialization. Besides, the methods and experiences for multilabel recognition and dataset construction are also worthy for useable.
- Mapping of labels: translate the labels in Open Images dataset and mapping the corrsponding labels in our project;
- Construction of dataset:extract the images with the annotations which have been verified by human according to the labels mapping.
Crawled data
Lack of the open source dataset
Our project is more focus on the scene of our nation, so it’s easily to find out there are three lacks of the Open Images dataset:
- The scenes that foreign contries don’t cover, such as the id card in our nation;
- The scenes that different from the foreign contries and China, and absolutely insufficient coverage. such as the museum;
- Lack of the images of long tail labels, such as the fine-grained categories.
Crawled data according to those three impacts for data supplement.
Coverage defined by customer
We crawl some data according to the example images of some labels provided by customer while these labels performance are not good on the test dataset of customer.
Internal accumulated data
The data accumulated during the collabrate with other internal group will more fit for scene in China, so I add these data according to the label mapping.
We exctract the data using the following two methods via internal tools:
- Key words crawling: crawl using the key words directly and verified by annotaor;
- Crawl by image search: Save the corresponding image to the example via image searching.
The initial dataset has a number of 900k images and every image has around 4 labels in annotation.
Data Cleaning
There are two important problems in a big dataset, one is label missing, another is label mistaken。
Data cleaning means using variety of methods to improve the quality of dataset, it’s the basic crucial factor for imporing the performance of model and algorithm.
Kaiming He[3] suggested that the performance of one label is relevant to the numbers of images, only if the numbers are bigger enough and then the shortage of the data has no affects to the model.
So there we have a assumption that we already have the baseline model and the test results of it, therefore, we can distinguish the labels which are amount number of data and doesn’t influence by the shortage of data itself, or some labels are easy to distinguish. Thus we focus on cleaning some labels which needs.
The cleaning method is the same for above two shortages:
- Extract label data
Extract all the data under one label.
- Construct the pseudo labels
The labels of one image are contained the following parts:
- Annotations of itself;
Labels of the model top5 prediction results which confidences are above the threshold of 0.5;
- The prediction results of competing products (mainly Baidu image recognition API) are mapped to our project tags.
- Cleaning
- Annotation standard: Refine and write the annotation document. The document focuses on defining the unique attributes of each label, therefore, it can guide the annotators to focus on the distinction;
- Visualize the annotation: Randomly sample some image annotations and visualize that for checking and correcting, updating the attributes of each label additionally. Fianlly, the accuracy of annotation is about 90%;
- Update the origin dataset.
Dataset division
We use 10-fold division and 1/10 is divide into test/evaluation dataset while others are train dataset.
三、Algorithm and processing
Solve the problem
Network structure
Early attempts
Diveding the labels into 12 parent-classes and train models separately using 12 datasets, then merge the networks in one for inference.
But it’s hard to optimize because of the properties of label systems themselves.
Baseline decision
We decide use these strategies to build our baseline drawing on the experience of the paper on Open Images dataset:
- Choose the Resnet[2] as a backbone model, which has been outperforming on challenge ImageNet2015, the trade-off of performance and speed for convergence with high accuracy is acctractive;
- Every neural of output layer is seen as a individual bianry classifier, and the loss function uses the basic Binary crossentropy loss[4];
- Training end-to-end and speed up using multi-gpu.
Then we can optimize according to the test results of the baseline and feedback from customer.
Algorithm optimization
Traning and convergence
Ablation study is useful for finding the best hyperparameters.
Learning rate warmup
All the parameters of network before training are initial using xavier initialisation[5] which are typically random values and therefore far away from the final solution. Using a too large learning rate may result in numerical instability. In the warmup heuristic, we use a small learning rate at the beginning and then increase the learning rate from 0 to the initial learning rate linearly when the training process is stable.[6]
Pretrain model
Transfer the knowledge of model trained on the large open source dataset which is helpful for training precision and the speed of convergence.[7] [8]
Cosine learning rate decay
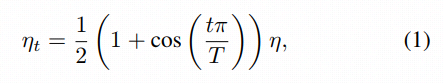
Cosine decay with learning rate warm up will more effeicient for training. Get the learning rete to decay cyclicity from initial value to 0.[13] We define that the whole batches are T, when training process gets into the t-th batch, the learning rate should be as the equation as follow:
Data imbalance
The distribution of data is always imbalance, some labels have a large number of data while the majority labels are in the situation lack of data.
Whether the assumptions of the data distribution for network or construction for loss function, the data imbalance impacts on deep model learning seriously. [9]
So according to these two assumptions, we add two optimizations from two perspectives. One is the feature optimization and another is loss function optimization, both are focus on reducing the affect of training performance when data is imbalanced.
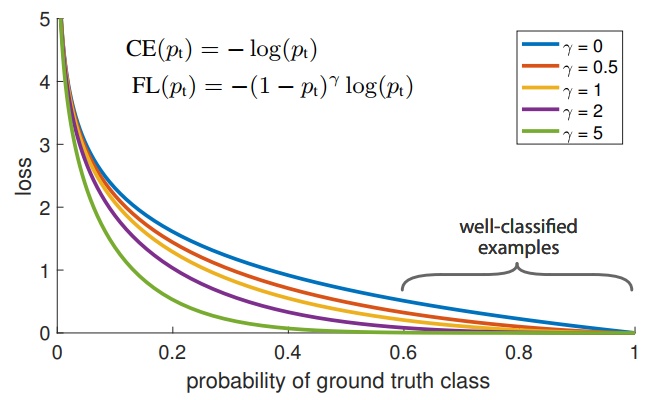
Feature level - Focal loss
kaiming He proposed the Focal loss[10] for avoid the easy negtive samples that contribute no useful learning signal for model training. On the one hand, the data distribution is imbalance; on the other hand, although the loss item of easy example is small, the large number of these easy example resulting the sum loss in the whole loss function, which lead to the easy labels and finally degenerate model.
We propose to reshape the loss function according to the focal loss and down-weight easy examples and focus on training on the hard distinguish samples of labels using sigmoid active function.
Parameters choosen need to do ablation study.
Data level - data augmentation
Data augmentation is efficient for improving the performance of model, we use the rasampling method to effficiently increase the frequency of weak tags in unbalanced data[3].
As for multi-label, the resampling needs to focus on two factor:
computation of the replication factor **r(h) **
Label-level:
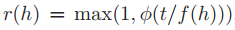
For each tag or label, the replication of it are in the interval of [1, r(h) ].
Image-level:Given an image I with (possibly multiple) hashtags {hi}, the image-level replication factor for I is computed as r(I) = maxi r(hi).
Choosen of the resampling function **φ(x) **
uniform
φ(x) = x
square root
φ(x) = √x, square root of the x
There is an another threshold need to select for representing the target frequence t of the every labels.
The following table shows the comparison of performance improvement when their recall is nearly similar.
| version | optimization strategy | AP improvement |
|---|---|---|
| v1.0 | baseline | - |
| v2.0 | baseline + resampling | 10% |
| v2.1 | baseline + resampling + focal loss | 3.2% |
Small scale Labels
The objects of some labels are small scale in the entire image such as the sunglass a man wearing, are always hard for model to recoginize. Therefore we use the object detection model to cooprate with our model and it performance well to those small scale objects. Directly use the SSD model[12] training on COCO dataset is enough for our project.
Prior relationship mapping
I proposed a prior relationship mapping for post-processing to complement the prior semantic knowledge according to the properties of label system itself.
Part of the mapping example is as follows:
The performance of self test and feedback is quite well, especially for the parent labels, such as the “sports” labels which contains a great varety of labels and the features are not unity for model learning.
Through out the iteration of the whole project, the combination of actual scenarios in real-world and requirements of the project is improtant for success.
四、Inference
The precision and recall of each class is very important, so we give a strong assumption that our self test dataset is clean enought to 95% accuracy of their annotations. That is, the labels missing or labels incorrect ratio is less than 5%.
Then I propose the precision-recall curve[11] strategy to get a best performance when the recall is kept at a certain value.
The precision-recall curve is computed according to the inference results of our self test dataset and then, we choose different threshold of one label and get the precision with exact recall. For example, the following figure is a PR curve of one label.
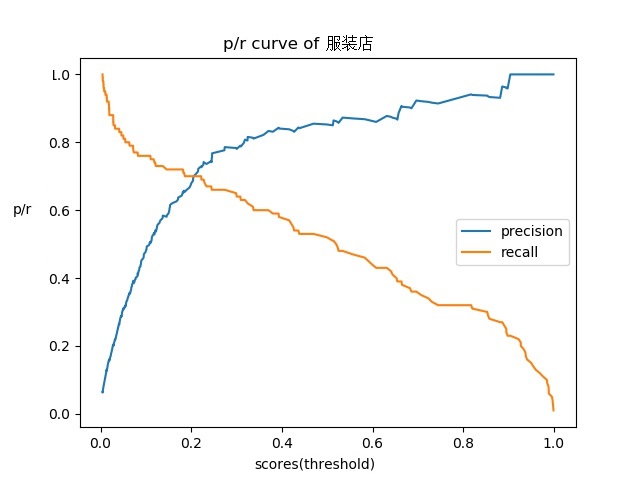
If we want to get to the standard of 90%/50% of precision and recall, we can choose threshold 0.6 according to the curve above.
Finally, the performance is beyond the expectation and has a smooth delivery.
五、Expand
Breadth of the project
Extension and construction of label system
Customized service
Extral algorithm attmept
- NAS: autoML for hyperparameters search
- Distillation: real time application
- Knowledge graph: construction of label system
- Cluster: label mining
Reference
[1] The Open Images Dataset V4
[2] Deep Residual Learning for Image Recognition
[3] Exploring the Limits of Weakly Supervised Pretraining
[4] torch.nn.BCEWithLogitsLoss
[5] Understanding the difficulty of training deep feedforward neural networks
[6] Bag of Tricks for Image Classification with Convolutional Neural Networks
[8] Must Know Tips/Tricks in Deep Neural Networks
[9] The Impact of Imbalanced Training Data for Convolutional Neural Networks
[10] Focal Loss for Dense Object Detection
[11] sklearn.metrics.precision_recall_curve
[12] SSD: Single Shot MultiBox Detector
[13] SGDR: Stochastic Gradient Descent with Warm Restarts(2016)